Sustainability Dashboards That Engineers Actually Use
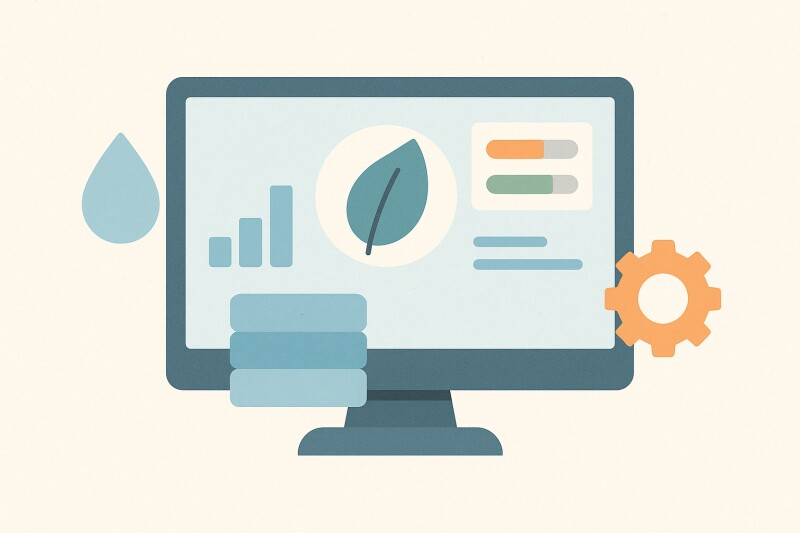
Most energy dashboards look impressive — but rarely influence real decisions. Engineers need sustainability tools that integrate with process data, speak their language, and close the loop between goals and controls.
What Makes a Dashboard Useful
- Context: Energy data aligned with production metrics, not isolated totals.
- Actionability: Clear thresholds that trigger alerts or work orders.
- Accuracy: Data sourced directly from PLCs, not manual entry.
- Accessibility: Available at the machine, not buried in corporate systems.
Key Metrics for Engineers
- kWh per part or batch
- Compressed air and steam losses
- Carbon intensity per production hour
- Energy cost vs. throughput trend
Integrating Dashboards with Control Systems
Link dashboards to your SCADA or MES through OPC UA or MQTT. Use historian data for baselines and automate updates. Apply color-coded KPIs (green/yellow/red) for instant interpretation by operators.
Case Example: Metal Components Manufacturer
A factory replaced its Excel-based energy reports with a real-time dashboard connected to the PLC network. Engineers reduced idle-time energy use by 14% in two months.
Related Articles
- From OEE to OGE: Tracking the Energy Side of Efficiency
- Smart Sensors for Compressed Air Leaks: Fast Payback
- Decarbonizing Heat Processes with Controls and Data
Conclusion
Sustainability dashboards should serve engineers — not just sustainability teams. When embedded into automation systems, they turn environmental targets into operational KPIs that drive measurable improvement.


Interested? Submit your enquiry using the form below:
Only available for registered users. Sign In to your account or register here.